


Published July 2026. All figures sourced to primary publications, with links. Where sources conflict, both are given.
Something unusual has happened across the three markets we track most closely. The UK, Pakistan and the UAE have almost nothing in common structurally, different currencies, different legal systems, different buyer bases, different stages of the cycle. Yet all three have been redirected over the last quarter by the same thing: an energy price shock originating in the Middle East, and the monetary policy response to it.
That common cause has produced three very different outcomes. It is worth understanding each on its own terms before drawing the thread between them.
A note on method. This piece is built from primary sources, the Office for National Statistics, the Bank of England, Moneyfacts, the Federal Board of Revenue, the State Bank of Pakistan, Savills, JLL and the Dubai Land Department. That choice matters more than usual this quarter. A significant amount of the commentary circulating on Pakistan is working from figures that were accurate in March and have since been overtaken. We flag the discrepancies as we go rather than smoothing them over.
Every figure below is attributed inline, and the full source list with links to the original publications is at the end.
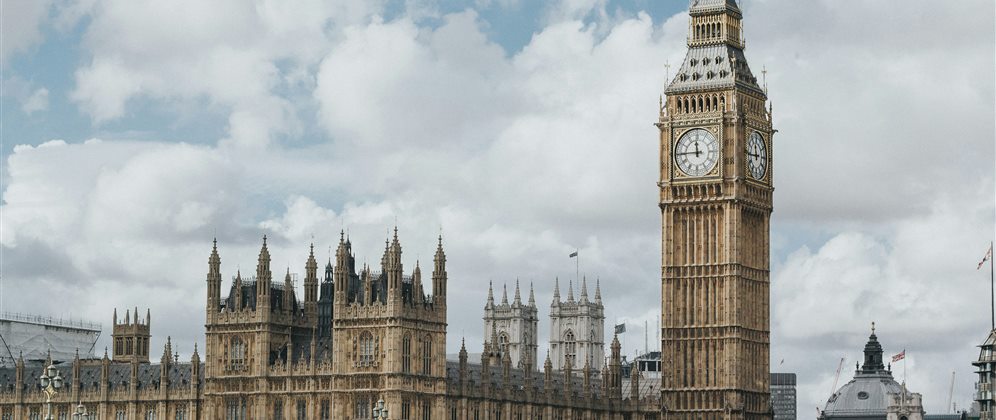
United Kingdom: Positive Growth, Contested by How Much
The indices disagree, and the disagreement is informative
Three major house price indices published figures this quarter. They do not agree
| Index | Period | Annual change | Average price |
| ONS / HM Land Registry (UK HPI) | May 2026 | 2.7% | £271,000 |
| Nationwide | June 2026 | 2.2% | £277,484 |
| Halifax/Lloyds | June 2026 | 0.6% | ~£300,000 |
This is not one of them being wrong. They measure different things, and knowing which to use for which purpose is genuinely useful.
ONS/UK HPI is based on completed transactions registered with HM Land Registry. It is the most comprehensive — it captures cash purchases, which the lender indices cannot, but it is also the most lagged. A purchase typically takes six to eight weeks from agreement to completion, so the May figure reflects decisions made in March. Use it for the definitive record of what actually happened.
Nationwide and Halifax are based on their own mortgage approvals. They are faster, but they capture only mortgaged purchases from a single lender’s book. Use them for the leading indicator.
The ONS reading carries an important technical caveat this month. Annual growth slowed from a revised 3.9% in April to 2.7% in May, but this was substantially a base effect rather than a change in underlying conditions. Prices rose 0.3% between April and May 2026, against a 1.5% rise in the same period a year earlier — and that 2025 spike was itself distorted by buyers rushing to complete before the April 2025 Stamp Duty Land Tax changes. The annual rate fell partly because last year’s comparison month was artificially high.
The regional picture depends on which index you read
This is where the divergence becomes most pronounced, and where a lot of commentary goes wrong by mixing sources.
Nationwide’s Q2 regional data (quarterly, three months to June):
- Northern Ireland: +8.6%; strongest by a wide margin, roughly four times the UK rate
- North West: +3.9%; strongest English region
- Scotland and Wales: +3.5% each
- London: +1.6%
- Outer South East: +0.1%; weakest
ONS data for May 2026:
- North East: +5.9%; strongest
- North West: +1.4% monthly, the largest monthly rise
- London: −3.7%; weakest, average price £545,000
Note that these tell materially different stories about London: Nationwide has it up 1.6% and describes it as the strongest southern region; ONS has it down 3.7%. Both are defensible given the methodological differences. Anyone quoting a single London figure without naming the source should be treated with caution.
What both agree on is the direction of the north-south divide. Nationwide puts Northern England at +3.1% year on year against +0.7% for Southern England. On Northern Ireland specifically, Nationwide notes that the strong run has now started to damage affordability there, the mortgage payment on a typical first-time-buyer property is around 31% of average take-home pay, even as UK affordability has broadly been improving. A typical Northern Irish home is now about 80% of the UK average price, up from 70% in Q1 2024, but still well short of the 125% recorded at the 2007 peak.
The rate outlook has reversed
This is the single most consequential change of the quarter, and it has not been widely absorbed.
At the start of 2026, consensus expected the Bank of England to continue easing, with the base rate falling toward 3.25%. That expectation is gone.
The Monetary Policy Committee held Bank Rate at 3.75% on 18 June, on a 7–2 vote. The critical detail is the direction of the dissent: both dissenters — Megan Greene and Huw Pill — voted to raise rates to 4%, not to cut. This was the fourth consecutive hold, and the hawkish minority had doubled from the single dissenter recorded at the 30 April meeting.
The Committee’s reasoning centered on the energy shock. Global energy prices had fallen since the previous meeting following developments in the Middle East, but remained above pre-conflict levels and volatile. The MPC emphasized the risk of second-round effects, the point at which higher energy costs stop being a one-off price level shift and start feeding into wage and price-setting behavior more generally.
The inflation data behind the decision is mixed in a way that explains the split. Headline CPI held at 2.8% in May, down from a 3.3% March peak. But services inflation, the measure the MPC watches most closely, because it is the best proxy for domestically generated, second-round pressure, rose to 3.7% from 3.2%. Unemployment edged up to 4.9%, which points the other way, suggesting a loosening labour market that could contain wage growth on its own.
The next MPC decision is 30 July 2026, published alongside a new Monetary Policy Report.
Mortgage rates fell anyway; Why that isn’t a contradiction
The Bank held rates and the hawks gained ground, yet fixed mortgage pricing improved. This looks contradictory and is not.
Moneyfacts reported that in July, the average two-year fixed rate fell 0.16 percentage points and the average five-year fell 0.11, with both settling at 5.52%. These were the largest monthly cuts since October 2024 and the lowest rates since March. The average new mortgage rate dropped 0.12 to 5.47%, the biggest fall since March 2025.
The reconciliation is that fixed-rate mortgages are not priced off Bank Rate. They are priced off swap rates, which reflect the market’s expectation of the future path of rates over the fix period, not today’s level. Only tracker and standard variable products move directly with Bank Rate — and consistent with that, the average SVR was unchanged at 7.13% while the average two-year tracker actually rose slightly to 4.49%.
What happened is that the US–Iran ceasefire pulled energy prices down from their June spike, which reduced the market’s expected peak for UK rates, which fed into swap pricing, which lenders passed into fixed products. The MPC held; the market’s forward view softened. Those are different things.
Two further details of practical relevance. The cuts reversed a three-month anomaly, running April to June, in which the average two-year rate sat above the five-year, an inversion that signals the market expecting rates to be lower further out. And pricing improved most at the high-LTV end: the average five-year fix at 95% LTV fell below 6% for the first time since March, to 5.92% from 6.02%, while the equivalent two-year fell from 6.23% to 6.13%. Product choice rose from 7,132 in June to 7,177 in July.
What this means
Growth is positive but decelerating, and the deceleration is partly a statistical artefact of last year’s stamp duty distortion. The regional divergence is the substantive story and it is widening. Borrowers refinancing now are getting better pricing than at any point since March, but that pricing reflects a market view that could reverse quickly if the July MPC meeting delivers a hawkish surprise or energy prices spike again.
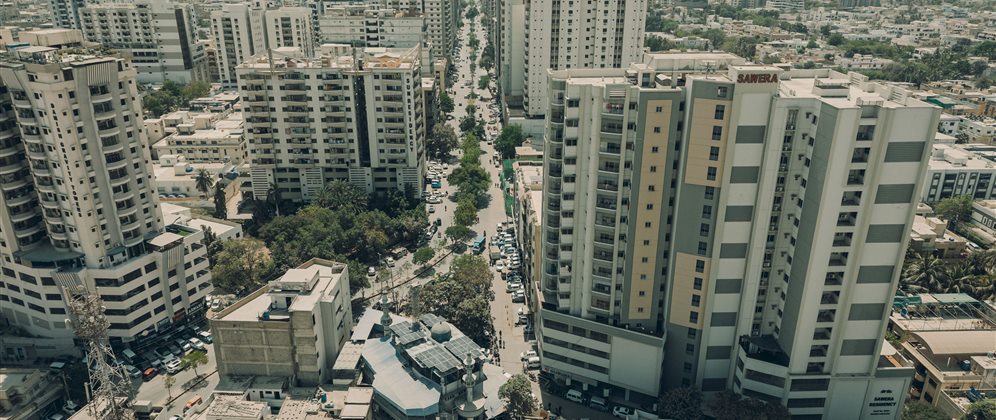
Pakistan: Real Tax Reform, Deteriorating Macro Backdrop
This section requires the closest reading, because the widely circulated version of it is out of date.
The tax reform is genuine
The Finance Act 2026, effective 1 July 2026 (Tax Year 2027), delivered substantive relief on property transactions. These are confirmed changes, not proposals.
Section 7E abolished entirely. This is the most significant item. Section 7E levied a 1% deemed income tax on the fair market value of vacant plots, secondary residential assets and non-earning real estate — taxing property on notional rather than actual income. It created a recurring holding cost on undeveloped land and inherited estates, and the associated 7E transfer certificate was a persistent administrative bottleneck on transactions. Both the tax and the certificate requirement are gone.
Section 236C (advance tax on sellers): flat 2.75%. Previously a tiered structure scaling from 4.5% to 5.5% by property value. Now a single flat rate for filers regardless of transaction size. Non-filer sellers face 11.5%.
Section 236K (advance tax on buyers): flat 1.25%. Previously banded from 1.5% to 2.5% by value. Now flat for filers irrespective of property size.
The late-filer tier is abolished in both sections. The previous three-way distinction between filer, late-filer and non-filer is now a two-way one.
Capital Value Tax on residents’ foreign assets: abolished.
Inherited property cost basis clarified. Property acquired by inheritance or family settlement now has its cost explicitly defined as fair market value at the date of transfer to the beneficiary, with family settlements treated as inheritance rather than as a sale. This removes a long-standing source of capital gains disputes.
Note also that both 236C and 236K are advance taxes, not final ones. A filer can adjust the amount withheld against their annual liability. The gap between filer and non-filer treatment is now the single largest cost variable in a Pakistani property transaction, which is the clear policy intent.
For overseas Pakistanis: non-residents holding a valid NICOP or POC qualify for filer rates on 236C and 236K even without ATL registration, subject to documented proof of fewer than 180 days’ presence in Pakistan.
A note on the 236K rate
Some commentary circulating gives the new buyer rate as 1.5% rather than 1.25%. Our reading is that 1.25% is correct. The professional consensus across published rate cards is consistent on this, and 1.5% appears to be the floor of the old band (1.5%–2.5%) rather than the new flat rate.
The genuine open item is elsewhere: FBR has not issued a settled non-filer schedule for TY 2026-27, and published rate cards differ on non-filer treatment. Filer rates are clear. Verify non-filer figures against FBR IRIS or the current Gazette before pricing any transaction that involves one.
The macro backdrop has moved sharply against it
Here is where the widely circulated bull case breaks down.
That case ran: falling interest rates, plus contained inflation, plus lower transaction taxes, equals a strong entry point. That was accurate in March 2026. Two of its three legs have since broken.
The policy rate rose. On 27 April 2026, the State Bank of Pakistan raised the policy rate by 100 basis points to 11.5%, effective 28 April. This was the first hike since June 2023, interrupting an easing cycle that had cut a cumulative 1,150 basis points from a peak of 22%. It surprised the market — only one economist surveyed by Bloomberg predicted the move. The SBP cited elevated global energy prices, freight charges and insurance premiums, and supply chain disruption following the intensification of the Middle East conflict.
At its 15 June meeting the MPC held at 11.5%, as easing oil prices and the US–Iran deal cooled inflation fears. So the current position is: rate raised in April, held in June. Anyone describing Pakistan as being in an easing cycle is working from pre-April information.
Inflation accelerated sharply. Per the SBP’s June statement, headline inflation moved:
| Month | Headline CPI |
| March 2026 | 7.3% |
| April 2026 | 10.9% |
| May 2026 | 11.7% |
Against a medium-term target range of 5–7%. The drivers were higher energy prices, increased transportation and production costs, and a sharp rise in wheat and food prices. The SBP expects inflation to remain in double digits for several more months before easing back toward target over the medium term.
The practical test: any analysis quoting Pakistani inflation at 4–5%, or describing an active easing cycle, is using data that is at least four months stale. Both were true in March. Neither is true now.
The genuine positives
The picture is not uniformly negative, and it would be as misleading to overcorrect as to ignore the deterioration.
- GDP growth improved. Provisional PBS estimates put FY26 growth at 3.7%, up from 3.2% in FY25, led by services and industry. Large-scale manufacturing expanded 6.5% during July–March FY26.
- Reserves strengthened. SBP foreign exchange reserves reached $17.2 billion as of 5 June 2026, supported by successful IMF EFF and RSF reviews, and were projected to reach $18 billion by end-June. Pakistan also re-entered international capital markets with a Eurobond issuance after a gap of over four years.
- Fiscal consolidation is broadly on track. The government estimated a primary balance surplus of 2.5% of GDP for FY26 and is targeting 2.0% for FY27, achieved primarily through expenditure restraint, notable given that FBR revised its FY26 revenue target down to around Rs 13 trillion.
The SBP explicitly noted that this combination of tight monetary policy and fiscal consolidation produced stronger initial conditions entering the current shock than Pakistan had in comparable past episodes.
What this means
The transaction-cost reform is real and durable, and for a long-hold buyer the abolition of 7E in particular changes the arithmetic of holding undeveloped land. But the financing environment is materially worse than it was in March: borrowing costs are higher, and real returns are being eroded by double-digit inflation the central bank expects to persist. These two facts need to be modelled together. A tax saving of 1.75 percentage points on a purchase does not offset a 100bp rise in financing costs on a leveraged multi-year hold.
Risks the SBP itself flagged: global commodity prices, energy tariff adjustments, weather-related pressure on food supply, and further geopolitical developments.
UAE: A Pricing Stand-Off, Not a Correction

The headline figures are not comparable
Considerable confusion is circulating about Dubai, and most of it comes from comparing sources that count different things over different periods. Set side by side:
| Source | Metric | Q2 2026 |
| Savills | Total residential transactions | 35,884, −19% QoQ |
| betterhomes | Total residential transactions | 34,850, −31% YoY, AED 84.9bn |
| DLD via DXB Interact | Residential transactions | 38,000+, −~33% YoY; value −40% to AED 110.4bn |
These are not contradictory. They differ on quarter-on-quarter versus year-on-year, on which transaction types are included, and on data source. The year-on-year comparisons are also being measured against an all-time-high base in Q2 2025. Note too that betterhomes recorded the quarter as still the third-highest second quarter on record, behind only 2024 and 2025 — a useful corrective to the framing of collapse.
The substantive shift: prices, not just volumes
Volume declines alone would be unremarkable. The meaningful change is that pricing has started to move.
Per Savills Q2 2026:
- Average apartment prices: AED 1,960 per sq ft, down ~4% quarter-on-quarter (from AED 2,010 in Q1)
- Villas and townhouses: AED 1,646 per sq ft, down ~0.8%
- Savills’ analysis of more than 500 like-for-like transactions indicates adjustments of 5–7%, with some locations down as much as 10%
- Prime transactions above AED 10 million: down 54% QoQ to 864 deals
- Roughly 27,300 residential units completed in the quarter, the highest quarterly delivery in recent years
The like-for-like number is the one to weight most heavily. Headline averages shift with the mix of what sold; like-for-like comparisons control for that.
Savills’ own characterisation is worth quoting for balance: the firm describes this as a normalisation of activity as the market adjusts to higher available stock and more selective buyers, rather than a broad-based correction, and expects performance to become increasingly localised, communities absorbing large new supply seeing further adjustment, supply-constrained locations proving resilient.
An important counterpoint: ValuStrat and other community-level trackers recorded price per square foot rising across the majority of tracked communities, led by prime villa areas such as Palm Jumeirah Garden Homes (+37% YoY) and Jumeirah Islands (+20%). Both things are true. The citywide average is falling while specific supply-constrained prime segments continue to appreciate. The market is bifurcating, not uniformly declining.
The mechanism: why this is a stand-off
The most useful way to understand Dubai right now is not as a correction but as a stalemate between sellers and financed buyers.
Sellers are anchored to 2025 benchmarks. Dubai recorded over 270,000 deals worth AED 917 billion in 2025, with the high-end segment posting roughly 33% price growth. Selling below those reference prices in response to what owners read as a temporary geopolitical shock feels like crystallising an unnecessary loss.
Owners are not forced to sell. Prime Dubai ownership sits largely in cash, high-net-worth, overseas and regional buyers, without mortgage obligations that would force a sale during a sentiment shock. Gross apartment yields reached 7.10% in March, so owners collect income while they wait. Rental declines in established areas such as Dubai Hills stopped at around 5.5%.
Financed buyers cannot close. Bank valuations have tightened. The result shows up clearly in agency data.
Per betterhomes Q2 2026 — and note that these are betterhomes’ own transaction book, not market-wide figures:
- Cash purchases: 61% of betterhomes deals, up from around 50% in Q1
- Buyer enquiries: −33% year on year, −23% quarter on quarter, with apartments (−41%) hit harder than villas and townhouses (−34%)
- Tenant enquiries: +20% year on year, +18% quarter on quarter, rising more than 60% between April and June
- Secondary market sales: −59% YoY to 8,512 deals
- Off-plan: eased just 12%, now 76% of all activity, up from 68% in Q1
For context on the cash figure: Knight Frank estimated market-wide cash sales at around 86% of Dubai transaction volume across the first three quarters of 2025. The betterhomes 61% is a rise within their own book, not a market-wide share, the direction of travel is the signal, not the level.
The enquiry split is the clearest evidence of a stand-off. Buyers stepping back while tenants step forward is what it looks like when demand has not disappeared but has been diverted — would-be purchasers staying in the rental market rather than leaving Dubai. Average rents remained 3.1% higher than Q2 2025, with villa rents up 5.7% year on year to AED 281,633, even as available supply rose 70–100% in some communities.
Off-plan resilience points the same way. Extended developer payment plans substitute for bank financing, which is precisely why off-plan held up while the secondary market absorbed the slowdown. Off-plan luxury sales actually rose 27% year on year even as secondary prime activity fell.
Supply is the variable to watch
This is where the genuine medium-term risk sits, and where published estimates diverge — so treat any single number with caution:
- 2026 deliveries: estimates range from ~74,100 (betterhomes) to ~75,000–77,500 (Savills, Cavendish Maxwell) units
- 2027: the peak year, with estimates from 146,400 to 160,700 units
- 2028: ~120,100 units
Two mitigating factors. Delivery has consistently run below schedule — Cavendish Maxwell expected Q2 2026 completions of 9,000–15,000 units against a scheduled pipeline of around 29,600. And new project launches collapsed from roughly 45,000 units in Q1 to around 5,000 in Q2, which reduces the pipeline further out.
Supply is also concentrated overwhelmingly in apartments, which is why villa and townhouse stock remains comparatively scarce, and why the two segments are pricing so differently.
The IMF’s assessment, issued 17 July following a staff visit, characterised UAE real estate activity as having moderated in the first half of 2026 with prices broadly remaining at or above 2025 levels. That is the most authoritative third-party read available, and “moderation underpinned by resilience” is a materially different claim from contraction.
Abu Dhabi is on a different cycle
Abu Dhabi is not a smaller version of Dubai. It is at a different point in its cycle with materially more disciplined supply, and it is accelerating while Dubai cools. Abu Dhabi transactions rose 112% to AED 117 billion in H1 2026, against Dubai’s AED 286.43 billion over the same period.
Two policy developments in Q2, both reported by JLL:
A rental freeze. A targeted intervention reshaping rental market dynamics, intended to cushion affordability pressure and support occupier retention.
Pre-handover mortgage financing. Several UAE banks began extending early-stage mortgage financing for off-plan property before handover. This is still limited in scope, it operates through specific developer-bank arrangements with completion thresholds, such as Dubai Holding projects via Emirates NBD at 30% completion with 50% of the payment plan paid, and Sobha projects via ADIB at 35% completion. But if it broadens, it directly addresses the financing constraint currently driving the Dubai stand-off.
Limited handovers should keep Abu Dhabi conditions relatively tight. Near-term activity may still moderate as buyers weigh geopolitical risk and recent price gains.
The Common Thread
Three markets, one shock, three different transmission mechanisms.
The shock was the same. Middle East conflict drove energy prices up, freight and insurance costs with them, and disrupted supply chains. Every one of these three markets imports that shock.
The transmission differed by structure:
- The UK absorbed it through monetary policy expectations. The energy shock stopped an easing cycle and turned the MPC’s dissenting minority hawkish. Housing responded to the rate path, not to the energy price itself.
- Pakistan absorbed it through inflation and the currency. As a heavily import-dependent economy, Pakistan could not absorb an oil price shock without it appearing directly in the CPI. Inflation went from 7.3% to 11.7% in two months and the central bank was forced into its first hike in three years — directly counteracting a tax reform designed to stimulate the same sector.
- The UAE absorbed it through sentiment and financing. Not through the energy price — the UAE benefits from higher oil, but through regional risk perception slowing buyer decisions, and tightened bank valuations preventing financed purchases from closing.
In all three cases, near-term direction now depends on a policy decision or a delivery schedule rather than on underlying demand. The UK’s turns on the 30 July MPC meeting. Pakistan’s turns on whether the SBP’s expectation of persistent double-digit inflation proves right. The UAE’s turns on the 2027 handover schedule and whether pre-handover financing broadens enough to break the stand-off.
That is an unusual configuration and worth naming explicitly. In each of these markets, demand fundamentals, population, household formation, employment, the desire to own property — are not currently the binding constraint. Policy and supply are. It means the useful thing to watch over the next two quarters is a small number of specific, dated events rather than broad sentiment.
Dates to watch:
- 30 July 2026 — Bank of England MPC decision and Monetary Policy Report
- 19 August 2026 — ONS UK HPI for June, including quarterly Northern Ireland figures
- Q3 2026 — SBP MPC meeting; the test of the double-digit inflation forecast
- Through 2026–27 — Dubai handover schedule against the 2027 peak
Sources
United Kingdom
- ONS / HM Land Registry, UK House Price Index, May 2026 — gov.uk
- Nationwide, Annual house price growth edges higher in June (June and Q2 regional HPI, 1 July 2026) — nationwide.co.uk
- Bank of England, Bank Rate maintained at 3.75% — June 2026 Monetary Policy Summary and Minutes (18 June 2026) — bankofengland.co.uk
- Moneyfacts, UK Mortgage Trends Treasury Report, July 2026
Pakistan
- State Bank of Pakistan, Monetary Policy Statement, 27 April 2026 — sbp.org.pk
- State Bank of Pakistan, Monetary Policy Statement, 15 June 2026 — sbp.org.pk
- Federal Board of Revenue, Budget 2026-27 Salient Features; Finance Act 2026 (Income Tax Ordinance 2001 amendments)
UAE
- Savills, Dubai Residential Market in Minutes, Q2 2026
- betterhomes, Dubai Residential Market Report, Q2 2026
- JLL, UAE Residential Market, Q2 2026
- Dubai Land Department transaction data (via DXB Interact)
- IMF staff visit assessment, UAE, 17 July 2026
This analysis is provided for information only and does not constitute investment, tax or legal advice. Property markets carry risk and past performance does not indicate future results. Tax rates and regulations are subject to change and to interpretation — verify current FBR rates against IRIS or the Gazette before pricing any transaction. Readers should take independent professional advice before making investment decisions.